
Validating offshore wake losses at scale: WakeMap in the German Bight
A two-buoy lidar campaign by TGS provides a rare window into real-world wake losses from one of Europe's most active offshore wind regions, and a rigorous test of Veer's WakeMap modelling approach.
Wake losses are larger than most models assume
Offshore wind farms no longer operate in isolation. In the German Bight and across the North Sea, multi-gigawatt clusters are already generating wakes that persist far beyond their own boundaries — reducing wind speeds, power output, and revenue at neighbouring and downstream projects. Observational evidence is growing. Airborne measurements in the German Bight, for example, recently recorded initial wind speed deficits of up to 43% near cluster edges, with wake signatures detectable more than 65 km downstream under stable conditions (Platis et al., 2022). The scale of the problem is real, and as we move towards 20+ MW turbines and multi-gigawatt clusters, the problem is only growing.
Continual observations of these losses are crucial, but equally crucial is ensuring that our models capture them accurately enough to be trusted in energy assessments and investment decisions. That requires validation, and validation requires measurements. As the next generation of 20+ MW turbines and multi-gigawatt clusters comes online, that need becomes more urgent, not less.
An unexpected opportunity for wake validation
TGS deployed two floating lidar buoys in the N11-N12 area of the German Bight to support wind energy development activity in the region. The buoys were positioned approximately 20 km apart for resource characterization purposes. Wake validation was actually not the original intent.
What emerged was something fortuitous. Several operating wind farms sit to the south and southwest at distances of 15 to 70 km. The geometry turned out to be well-suited to isolating wake effects: when wind blows from those directions, one buoy sits in the wake shadow of the upstream cluster while the other measures the undisturbed freestream. By computing the ratio of wind speeds between the two sites sector by sector, it becomes possible to read the wake signal directly from the observed data.
The result is a dataset rare in its clarity: a continuous, spatially resolved record of long-distance offshore wake losses, captured by instruments that happened to be in exactly the right place.
Putting WakeMap to the test
Veer's WakeMap uses the Weather Research and Forecasting (WRF) model with a wind farm parameterization to explicitly resolve turbine-induced momentum extraction and turbulence across an entire region. Unlike engineering wake models that apply simplified decay formulas, WakeMap captures the time-evolving interaction between multiple upstream clusters, atmospheric stability, and local flow conditions.
Modelled wind speeds were extracted at the two buoy locations and the same sector-averaged wind speed ratio was computed from model output as from the observations. Same metric, same sectors, same locations — providing a direct test of whether the model reproduces what actually happened in the field.
What the results show
The figure below shows sector-averaged wind speed ratios from both the TGS lidar observations and WakeMap output. The dotted line indicates no difference between sites. Values greater and lower than one reflect higher wind speeds at Site A and Site B, respectively. Axis labels have been omitted to protect the commercial value of TGS's dataset
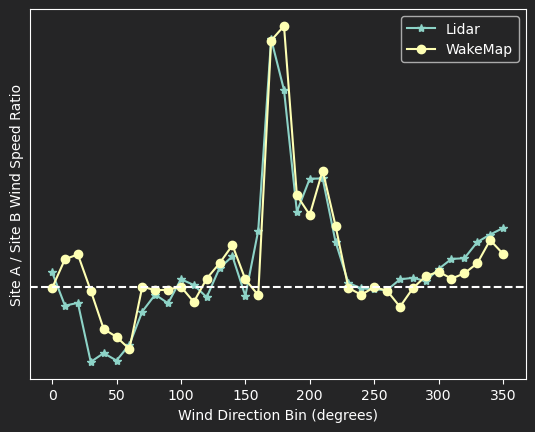
Mean 100-m wind speed ratios between Site A and Site B by wind direction sector. WakeMap (modelled) and TGS observations (measured) shown by sector. Axis labels omitted.
Across the primary waked sectors (160 to 220 degrees), WakeMap tracks the observed ratio closely, reproducing both the large magnitude and directional structure of the wake signal. In unwaked sectors, model and observations generally converge to a value of one. However, there are notable deviations, especially in the 30-60 degree sector, likely due to inhomogeneous flow conditions as winds come off the complex coast of Northern Germany. Here, we do see some differences between the observed and WakeMap-modelled winds, although the model is generally in broad agreement.
The case for purpose-designed wake measurement campaigns
Validating offshore wake models is genuinely difficult. Operational wind farm data are almost always confidential. Single-location met masts lidars can detect wakes but require long periods of record to capture “pre-wake” and “post-wake” conditions, and that is a major limitation.
The two-buoy geometry that emerged from TGS's German Bight deployment sidesteps most of these problems. That it arose from a development-focused campaign rather than a purpose-designed validation effort makes the result more impressive, and points clearly to what becomes possible when buoy placement is designed with wake quantification explicitly in mind. As the next generation of multi-gigawatt projects comes online, that kind of deliberate measurement infrastructure will be essential for reducing wake uncertainty to bankable levels.
Knowing where to place instruments for maximum wake observability is itself a modelling problem, one that requires understanding the spatial structure of wake losses across all wind directions before a single buoy enters the water. That is precisely where WakeMap adds value: it can inform the design of an optimal wake measurement campaign. As WakeMap's agreement with offshore wake observations grows across studies, confidence that it is pointing in the right direction continues to build.
Looking ahead
Veer and TGS are continuing to develop results from this campaign, with additional analysis exploring seasonal variability and interannual patterns in the observed wake losses. We welcome conversations with developers, asset owners, and independent engineers thinking about how wake uncertainty affects their projects.
About WakeMap
WakeMap is Veer's high-resolution wind resource and wake modelling product, built on WRF with the Fitch wind farm parameterization. Designed for offshore and complex terrain applications where engineering wake models fall short. Learn more at [veer.eco/wakemap].
About TGS
TGS provides energy data and intelligence to the global energy industry. Their offshore wind measurement portfolio includes floating lidar campaigns supporting resource assessment, development planning, and as this study demonstrates, wake characterization at commercially relevant scales. Learn more at tgs.com/wind.